This post is based on Ilin et al. (2021) and (2023).
Introduction: The problem of stars being point sources on the sky
Stars appear to us as point sources. There is no telescope big enough to resolve the surface of a star like we do with the Sun. But astronomers desperately want to see those surfaces, as a million interesting things happen on them. By looking at the point sources, they have concluded that there must be spots, flares, plagues, prominences and faculae: features of a dynamic stellar magnetic field generated inside – just like on the Sun. If we understand these features, we can understand the star’s behavior over long periods of time, and better estimate the habitability of planets that orbit them. For instance, flares are gigantic explosions that randomly occur on the Sun (Fig. 1). They are famously causing auroras, geomagnetic storms, and kill satellites in Earth’s orbit.
 Figure 1. Solar flare observed at 30.4 nm (extreme UV) in March 2023. Credit: NASA
However, by simply buying the solar paradigm of spots, flares, etc., we extrapolate from the Sun to other stars, based on what we gather from the stellar light. Yet many stars, in particular the most abundant kind of star, M dwarfs, often weigh only a tenth of what the Sun puts on the scale, and have a totally different interior structure. While the Sun has a radiative core, and a convective envelope around it, M dwarfs lack the core, and instead are fully convective. The models we use to explain how magnetic fields are generated inside a star with a radiative core don’t work on a star without one, because many models posit that the field is generated at the boundary between the core and the envelope. But M dwarfs still show very strong magnetic fields entirely without a core! Perhaps, the fields are generated by a different process than on Sun-like stars, and the magnetic features are very different. Even if some phenomena, like flares, look suspiciously similar across all stars, we only see the entirety of the light that the stellar surface emits. We cannot tell where the flare happened on the surface. The individual light particles do not carry spatial information beyond what star they come from. It is like guessing an object purely from its color. It might be a very distinct color, but without further information, you can’t tell a flamingo apart from a Barbie.
An uninhabitable habitable zone?
Imagine a planet in the habitable zone of an M dwarf. Since the planet is so small, the habitable zone is very close to the star. Far inside the orbit of Mercury. At the same time, flares on those stars carry orders of magnitude more energy with them than their solar counterparts.
But the Sun is old, so its flares are weak, and Earth is at a safe distance. However, if a planet around an M dwarf happens to be in the way of such an eruption, it may be hit by the blast. Then, with all the energetic particles that come with a large flare, you better be elsewhere. Your planet might lose its ozone, or its atmosphere altogether (Fig. 2). Important to note for what comes next: This is the situation if we extrapolate from the Sun, where flares usually occur at low latitudes close to the equator, which is roughly in the plane where the Solar System planets orbit around it.
In addition to being the most abundant kind of star, it so happens that Earth-like planets in the habitable zone are also most abundant around exactly those flare-spitting monsters. Also, among all stars, M dwarfs also live the longest – 10–100 times longer than the Sun. Statistically, this makes them the place with the most opportunities for producing life, and then sustaining it for a long time. But with its activity, the star might just nip things in the bud. So no aliens? (Or just none that need an atmosphere to breathe?)
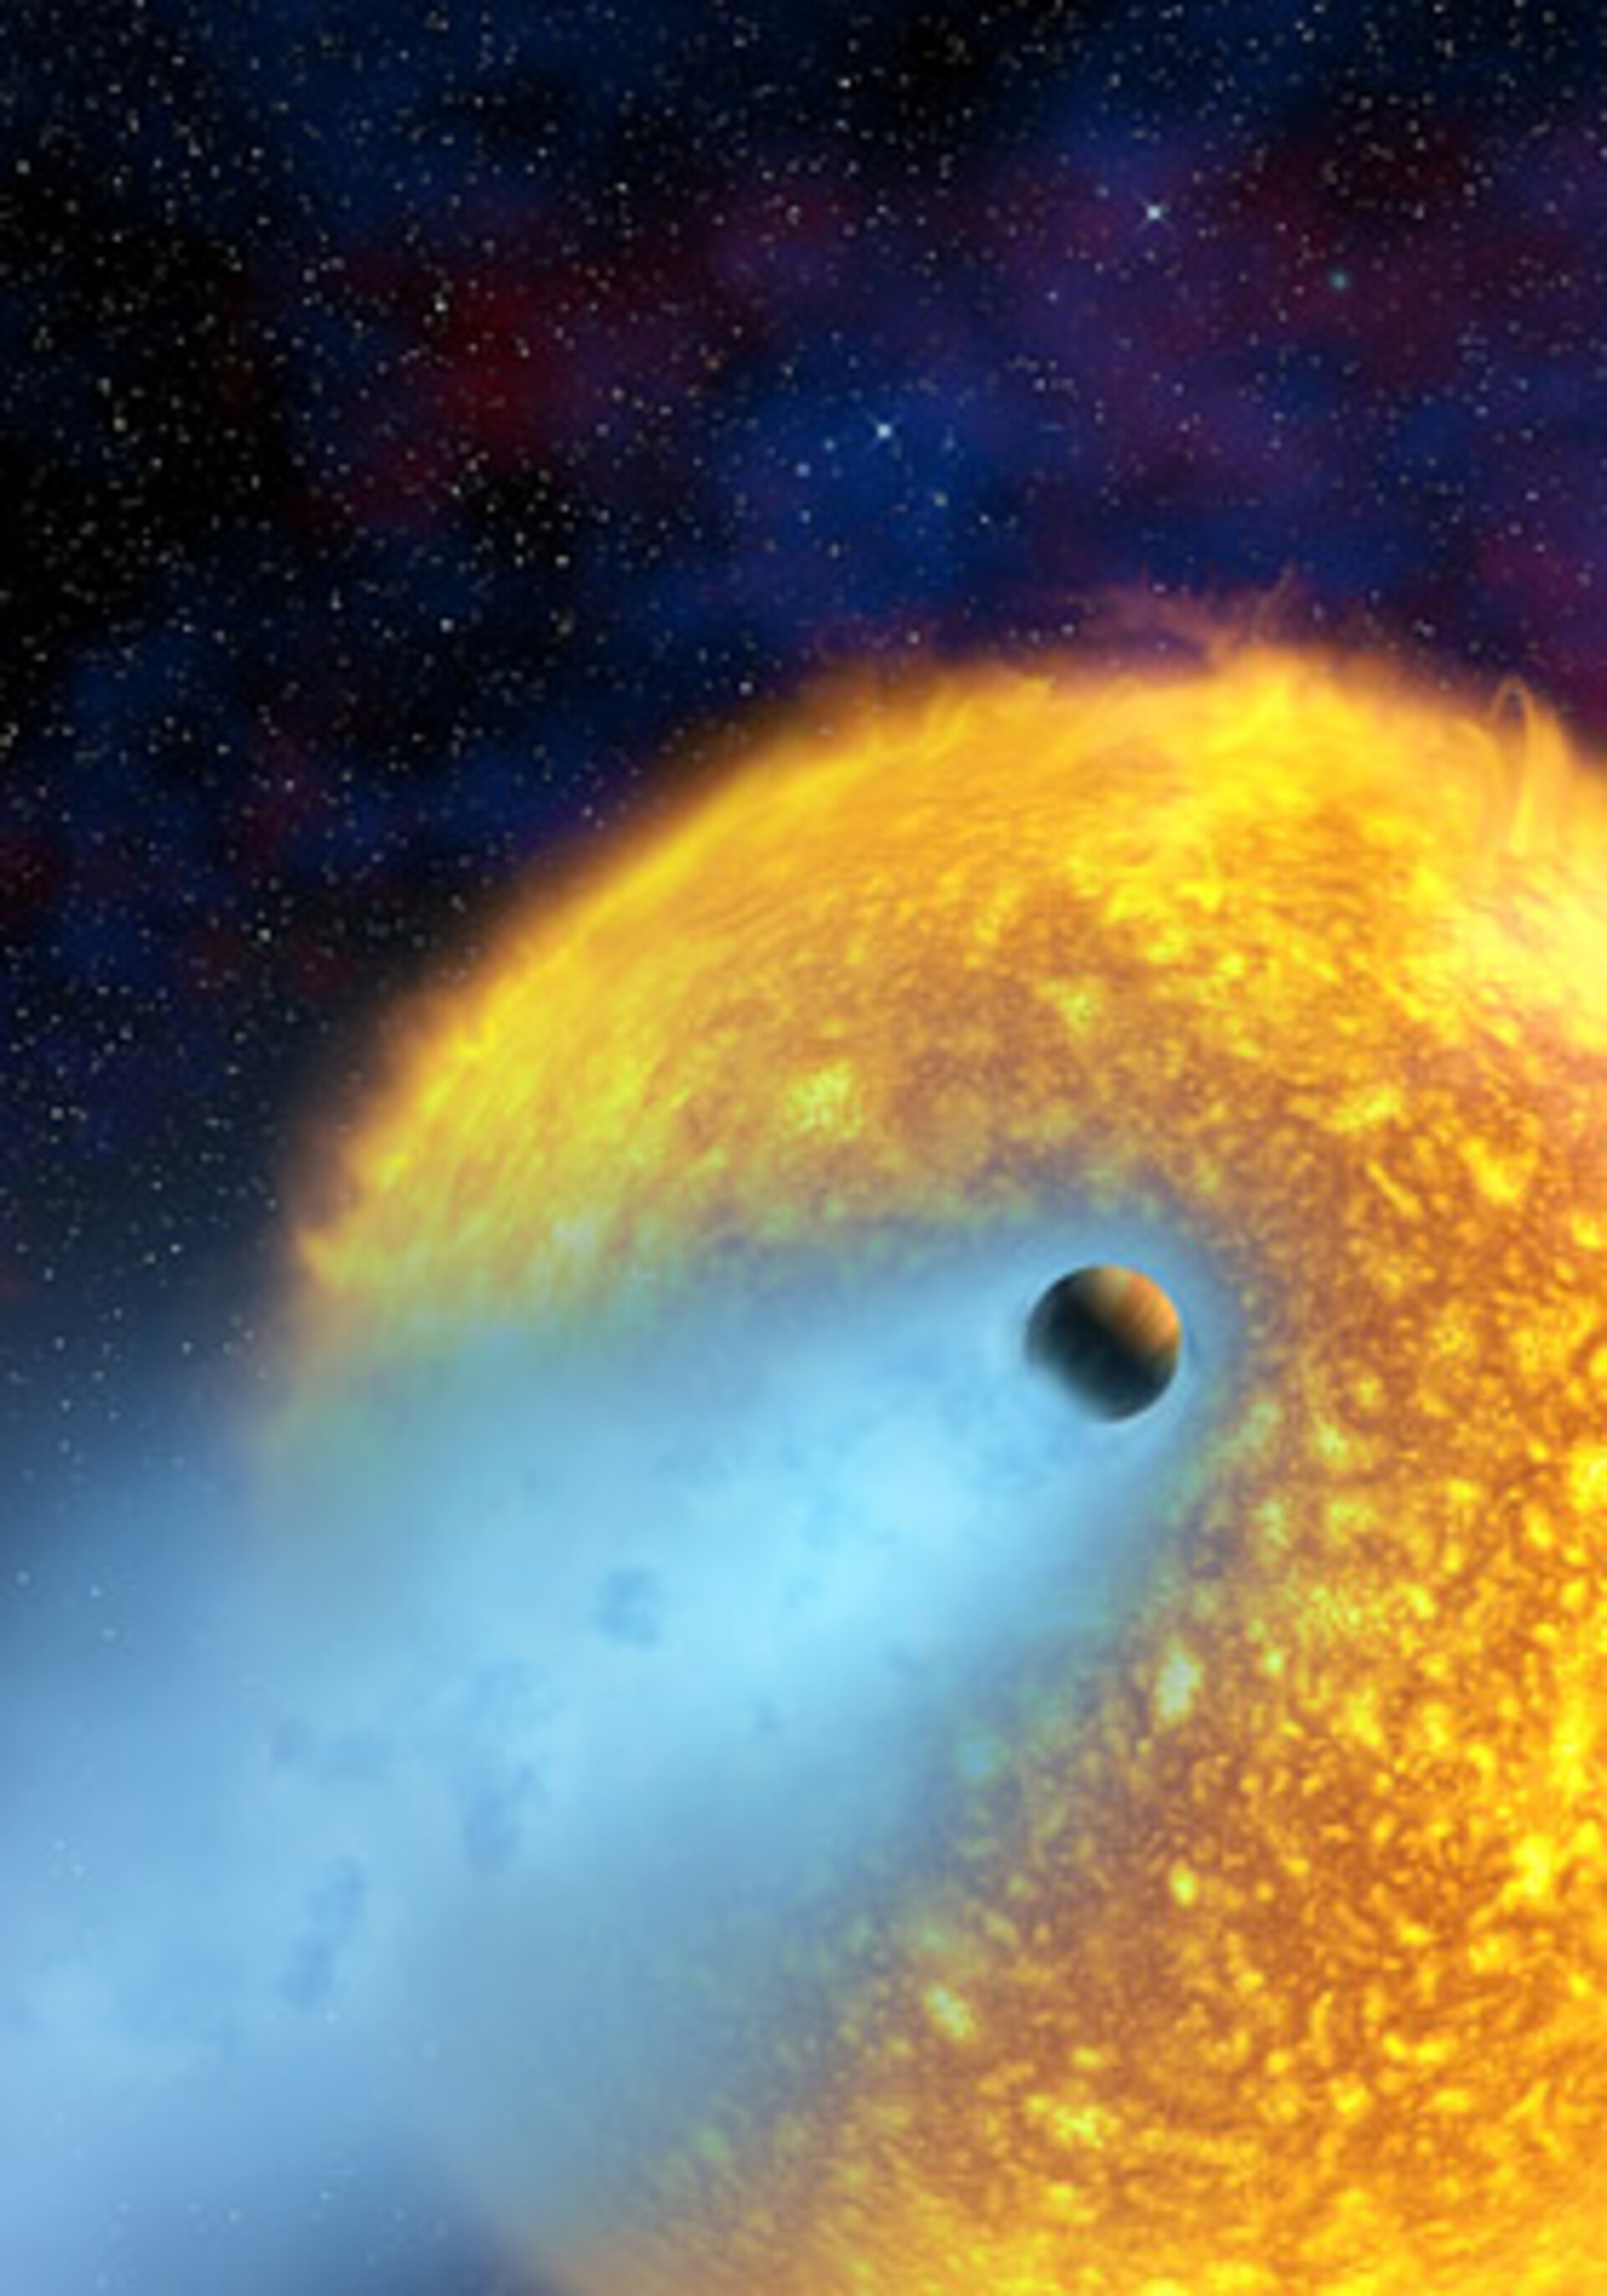 Figure 2: Artist’s impression of a planet losing its atmosphere due to the intense radiation and particles from its host star. Credit: ESA
Don’t assume the Sun to find habitable planets
Flares on the Sun occur pretty close to the solar equator. That’s roughly in the same plane where the Earth revolves around it. Any particles ejected from the equator of the Sun will move nearly radially outward, approximately within that plane. If Earth happens to be in the direction of the ejected material, it is hit by the blast. However, we don’t know if that is the case on M dwarfs. Because we don’t know where flares occur on these stars.
In 2021, my colleagues and I found out that if we combine extremely high quality spectral and time series observations1, we can tell that at least some M dwarfs show flares close to the pole instead of the equator. Now, that’s not what we would have expected based on our extrapolation earlier! And it has a striking consequence: Particle storms erupting from a near polar region are less likely to hit a planet that orbits in the star’s equatorial plane (which many planets do)2. So maybe the outlook for happy aliens on M dwarf planets is not so bleak after all.
Learning how to locate flares on all kinds of stars
However, the method we used above to tell the flares’ latitudes only works if the flare is very large, and the star rotates very fast. You need to look for about 120 years non-stop at a star to find one such flare. (Nobody has 120 years, so we look at many stars simultaneously to save time). As of now, we only know of a handful of flares where we can apply this technique. But what about the smaller flares, and the more slowly rotating stars, that make up the majority3 of both flares, and stars? We need a better trick to locate them.
This is what our most recent paper is about. It is about a new technique to tell where flares occur on the stellar surface, although we only see it as a point source.
To understand how we can pull this trick, we need some context about inclination, that is, the orientation of the star’s rotation axis. The inclination of its rotation axis towards the observer, and the latitude of a flare, are ambiguous. A flare at a low latitude on a star with a certain inclination looks almost the same as a flare at a higher latitude on a star with a higher inclination. To lift this ambiguity, for the rapidly rotating stars with large flares, we had to use the high-resolution spectroscopy to measure the inclination, so that we could tell the latitude.
The same ambiguity occurs in the timing of flares. Flares occur at random times in a given active flaring region on the star. When the region hides on the back of the star, we don’t see the flares that occur there (Fig. 3). The time that the flaring region spends on the back of the star during each rotation, call it hiding time4, depends on inclination and latitude. If we don’t know the inclination, we cannot tell the latitude (Fig. 4).
 Figure 3: A rotating star with a flaring latitude strip with three flaring active regions. The star is inclined such that the flaring regions are only seen for a fraction of the stellar rotation. The intrinsic light curve below shows flare peaks that we would see if we could follow the active regions around the star. But since we sit on Earth and only see the star from one side at all times, we end up with the observed light curve instead, where we miss a bunch of flares due to the active regions’ hiding time. Credit: own work
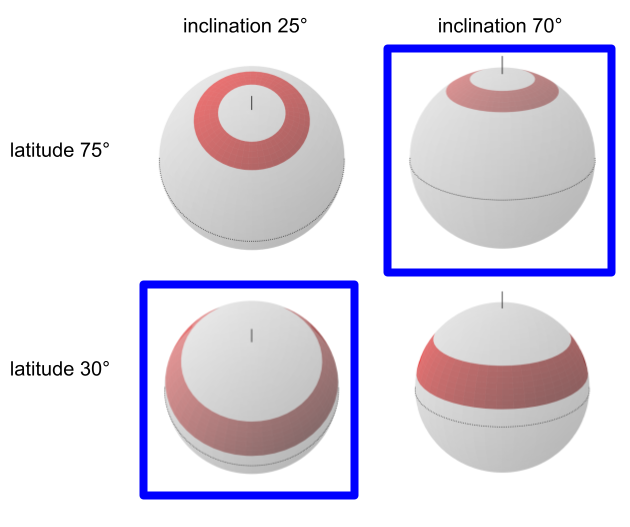 Figure 4: The ambiguity between latitude and inclination. The four stars have four distinct inclination-latitude combinations, but you cannot tell apart the ones marked in blue by looking at the hiding time of a flaring region. The hiding time is the portion of a stellar rotation during which a flaring region in the red strip is not visible to us. Credit: own work
Our main result is that this latitude effect on hiding time does not cancel out when we mash many stars in one sample. And this is the new trick: If we assume that inclinations are random, and combine observations of flares on a large (>100-200) number of stars, we will know very well what inclinations will be present overall, although we won’t know the inclinations of individual stars. In other words, we statistically break the ambiguity between inclination and latitude. In the paper, we describe how we can calculate the average latitude at which the flares occur in a collection of randomly oriented stars – if we account for the distribution of inclinations in the sample.
Put simply, we make use of how the time that the flaring region is hidden from us increases how long we have to wait for the next flare to occur – which directly depends on latitude. If this hiding time is long, the flaring regions are at low latitudes. If it is short, the flaring regions are at higher latitudes.
Using solar doppelgängers for a test
As a first test on real data with our method, we selected stars that were as similar to the Sun as possible, hoping that extrapolating from the Sun would be least dangerous here. The sample we got was too small (less than50 stars) to say anything definitive about the latitudes yet, but the results regarding the number of regions are promising – we see a difference between fast and slowly rotating Sun-like stars, as we expected from theory. Slow rotating stars seem to have more (or faster growing and decaying) flaring regions, while fast rotating ones have fewer.
What matters to habitability
It is a long way before we can confidently produce maps of tiny stars – more observations are needed. But as we keep moving forward, the continued monitoring of thousands of stars by the Transiting Exoplanet Survey Satellite, and upcoming missions like PLATO, will deliver data necessary to apply our method on a large scale. The result might well shift our understanding of what actually matters to habitability.
Footnotes
-
from the SALT observatory in South Africa and the Transiting Exoplanet Survey Satellite ↩
-
Whether we can “much less likely” or just “less likely” here depends on how much the stellar magnetic field can bend the erupting particles back towards the equator. On the Sun, this is the case, and some models for other stars suggest that would happen, but it’s not clear if that bending would only change the particles’ trajectory by a few degrees (“much less likely”), or by tens of degrees (“less likely”). ↩
-
The energy distribution of flares is a power law, and we don’t know where the low energy end of that distribution is. “Majority” here means >95% for sure, in numbers of flares at least. But numbers might not be the relevant thing here. It could be energy instead. Particle eruptions and coronal mass ejections on the Sun, i.e., the sources of space weather, very rarely occur with a high energy flare. Smaller, frequent flares, do not all cause space weather. So I wave my hands and say “majority” to avoid this difficulty. ↩
-
we call it night length in the paper ↩